OBD2 scanner graphing abilities offer a powerful way to diagnose vehicle problems. Understanding these capabilities can transform your diagnostic process, offering insights beyond basic code reading. From identifying intermittent issues to monitoring sensor performance in real-time, graphing features empower you to pinpoint the root cause of malfunctions efficiently and effectively.
Choosing the right OBD2 scanner with robust graphing capabilities is crucial. Some scanners offer basic graphing while others provide advanced features like data logging and customizable views. Knowing what to look for can make a significant difference in your diagnostic capabilities. For a detailed guide on selecting the best OBD2 scanner, check out our resource on buy a car code reader obd2 scanner.
Understanding the Basics of OBD2 Scanner Graphing
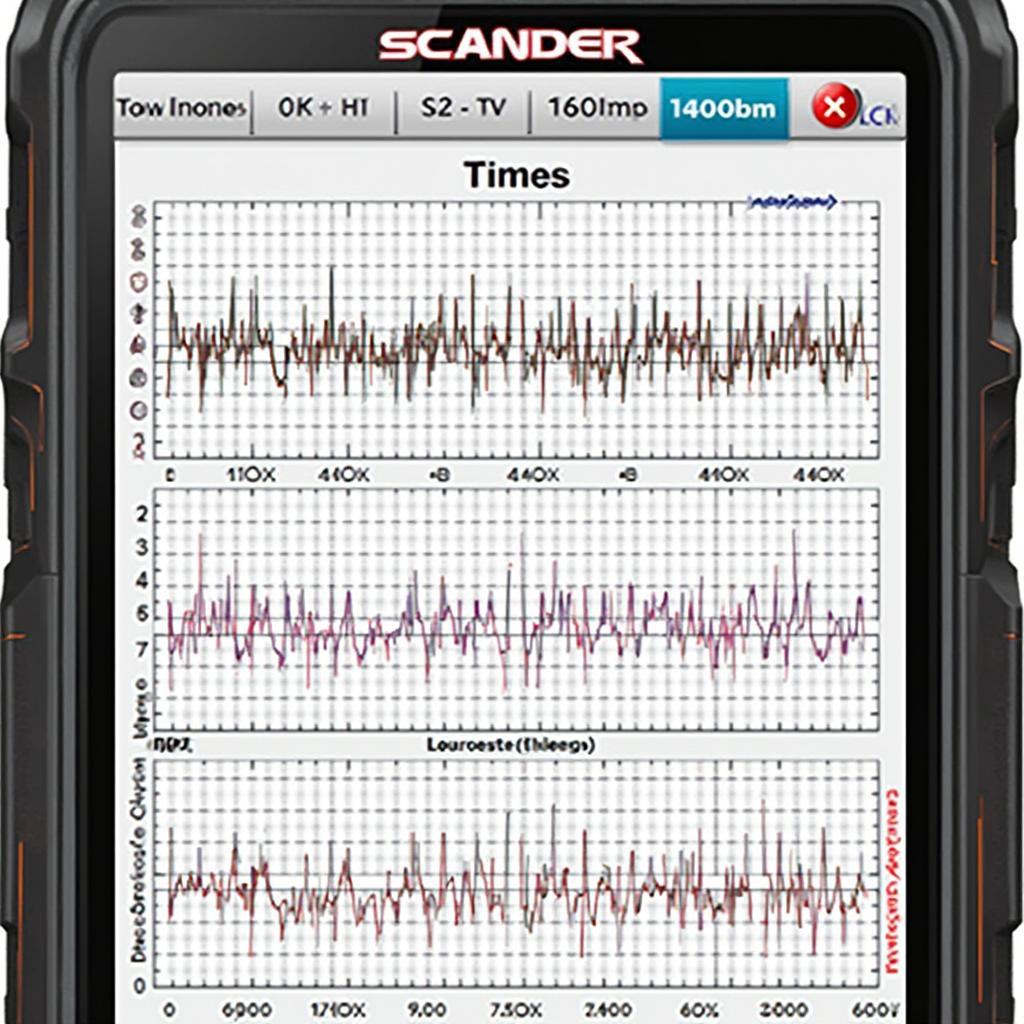
What do OBD2 scanner graphing abilities actually do? Simply put, they visually represent data streamed from your vehicle’s sensors. This visual representation makes it much easier to spot anomalies and patterns that might be missed when simply looking at raw data values.
Why is Graphing So Important?
Graphing allows for the observation of trends over time. This is especially useful for diagnosing intermittent problems that might not show up during a static code scan. Imagine trying to diagnose a rough idle that only occurs under specific conditions. With graphing, you can monitor relevant parameters like engine RPM, fuel trim, and oxygen sensor readings while recreating the conditions that trigger the rough idle. The graph will visually display any deviations or inconsistencies, leading you directly to the source of the problem.
Advanced Graphing Features to Look For
Not all OBD2 scanners are created equal. When looking for a scanner with robust graphing capabilities, consider the following features:
- Live Data Streaming: Real-time data displayed graphically allows you to monitor sensor values as they change, essential for dynamic testing.
- Data Logging: The ability to record data over time for later analysis is invaluable for capturing intermittent issues.
- Customizable Views: Being able to select which parameters are graphed and adjust the scaling of the graph offers flexibility and control.
- Multiple Parameter Graphing: Viewing multiple parameters simultaneously allows you to see how they interact, providing a comprehensive picture of system performance.
- Zoom and Pan: The ability to zoom in and pan across the graph allows you to focus on specific areas of interest for detailed analysis.
“A powerful graphing function can be the difference between a quick diagnosis and hours of troubleshooting,” says automotive diagnostics expert, Dr. Emily Carter, Ph.D. “It’s like having an x-ray vision into your vehicle’s systems.”
Practical Applications of OBD2 Scanner Graphing
OBD2 scanner graphing abilities have a wide range of practical applications:
- Diagnosing Sensor Problems: Graphing allows you to visually inspect sensor output for erratic behavior, identifying faulty sensors quickly.
- Monitoring Engine Performance: Track parameters like RPM, fuel trim, and intake air temperature to optimize engine performance.
- Troubleshooting Emission Issues: Analyze oxygen sensor readings and catalytic converter efficiency to diagnose emission-related problems.
- Verifying Repairs: After making a repair, use graphing to confirm that the issue has been resolved and the system is functioning correctly. If you’re looking for OBD2 scanner information related to a specific car model, you can find useful resources on our site like 2002 us mazda mpv obd2.
Conclusion
OBD2 scanner graphing abilities provide an essential tool for anyone serious about vehicle diagnostics. By understanding how to leverage these capabilities, you can diagnose problems more efficiently, save time and money, and gain a deeper understanding of your vehicle’s systems. Choosing a scanner with robust graphing features is a worthwhile investment that will pay dividends in the long run. For those interested in exploring software options, consider checking out resources like auto diagnostic software obd2.
FAQ
- What is the benefit of using an OBD2 scanner with graphing capabilities? Graphing allows for visual analysis of data, making it easier to spot trends and anomalies.
- Can I use graphing to diagnose intermittent problems? Yes, graphing is especially useful for capturing intermittent issues that might not show up during a static code scan.
- What are some important graphing features to look for in an OBD2 scanner? Live data streaming, data logging, customizable views, multiple parameter graphing, and zoom/pan functionality.
- How can graphing help me troubleshoot emission issues? By analyzing oxygen sensor readings and catalytic converter efficiency.
- Is graphing useful for verifying repairs? Absolutely, graphing can confirm that the issue has been resolved and the system is functioning correctly after a repair.
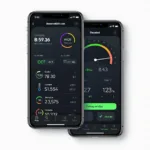
- Can I connect my OBD2 scanner to my Android phone via Bluetooth and utilize graphing features? Many OBD2 scanners offer Bluetooth connectivity to Android devices, allowing you to use graphing apps. Explore our resources on obd2 scanner android bluetooth for more information.
- Are there specific OBD2 graphing considerations for different car models, like the Hyundai ix35? While the general principles of OBD2 graphing apply to most vehicles, understanding model-specific parameters and data interpretation can be beneficial. Check out resources like ix35 obd2 for more details.
Need support? Contact us via WhatsApp: +1(641)206-8880, Email: [email protected] or visit us at 789 Elm Street, San Francisco, CA 94102, USA. Our customer support team is available 24/7.